Pie Chart Maker
Pie Chart Maker is a very easy to use tool to make pie chart or doughnut chart from raw information.
You will find at the bottom of this page tutorial about how to use this pie chart creator.
Options
Pie Chart Download
About Pie Chart Creator
Pie Chart Genrator has been built to help those who want to create a pie graph or doughnut graph to do it as easy as possible.
The following is a tutorial about how to use this Pie Graph Maker:
- Title:
- Title Text: Write in this box the pie chart title. This will appears on the top of the pie graph. The maximum length of the pie chart title is 500 letters.
- Title Font-Size: This box will control the title font size. The size must be an integer and between 10 and 30 without unit, which is in px.
- Title Color: Change to the color you want.
- Title Position: Change the position of the title.
- Labels: This box determine the number and names of the pie chart slices, for ex if you want to create two slices called TV and Internet respectively, you should type "TV;Internet", note that they are separated by semicolon ";".
- Data Sets: Determine the number of groups you want to compare with each other, for ex if you want to compare between boys and girls each group will have its own slices, then you have to select the data sets to 2.
- Set Name: If we continue from the previous step, the set name of the first group will be "Boys" and the set name of the second group will be "Girls".
- Slices Values: Here you have to insert the values for each column of a single set. for ex "38;62" these are two values for two slices of one set, note that the are separated by ";".
- Colors: Use this box to determine the color of each column (Insert colors separated by ";" colors number must be identical to slices number for ex #00f0f0;#57ff6e these are two colors for two slices of one set) or the color of the total set (Insert only one color which will be applied to all slices on the set).
The color box is to facilitate the process of selecting the color you want, which will be inserted in the box above it. - Legend:
- Font-Size: This box will control the legend (the stes names) font size. The size must be an integer and between 10 and 30 without unit, which is in px.
- Font-Color: Change to the color you want.
- Position: Change the position of the legend.
- Background Color:
- Area: This box will control the area where this color will be applied.
- Background-Color: Change to the color you want.
Pie Chart Maker
Example #1:
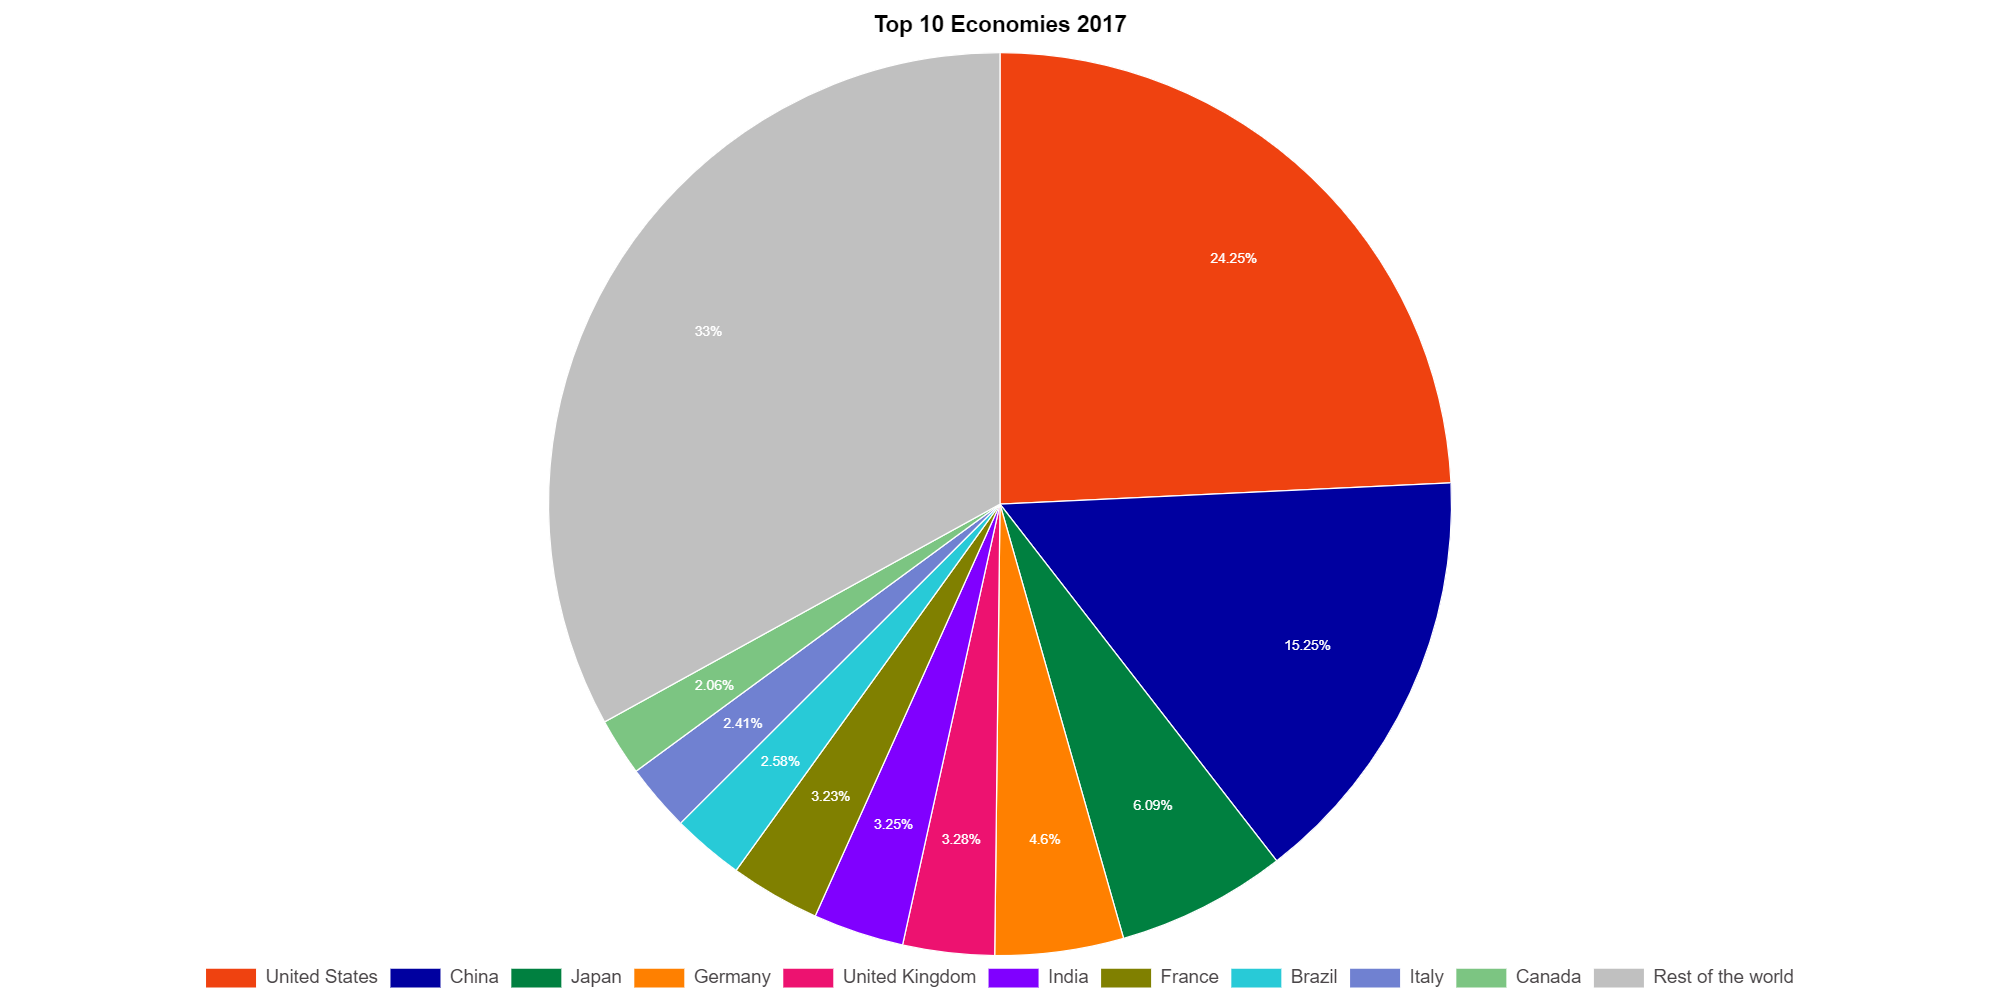
This is an example of Pie chart generated from this page:
- Chart Type: Pie Chart
- Title:
- Title Text: Top 10 Economies 2017
- Title Font-Size: 18.
- Title Color: #000.
- Labels: United States;China;Japan;Germany;United Kingdom;India;France;Brazil;Italy;Canada;Rest of the world
- Data Sets: 1
- Set Name: Economy
- Slices Values: 19.4;12.2;4.87;3.68;2.62;2.60;2.58;2.06;1.93;1.65;26.41
- Colors: #ef4210; #0000a0; #008040; #ff8000; #ed1270; #8000ff; #808000; #28cad7; #7081d1; #7cc582; #c0c0c0
- On Chart (OC): Percentages
- OC: Font Size: 11
- OC: Font Color: #ffffff

Example #2:
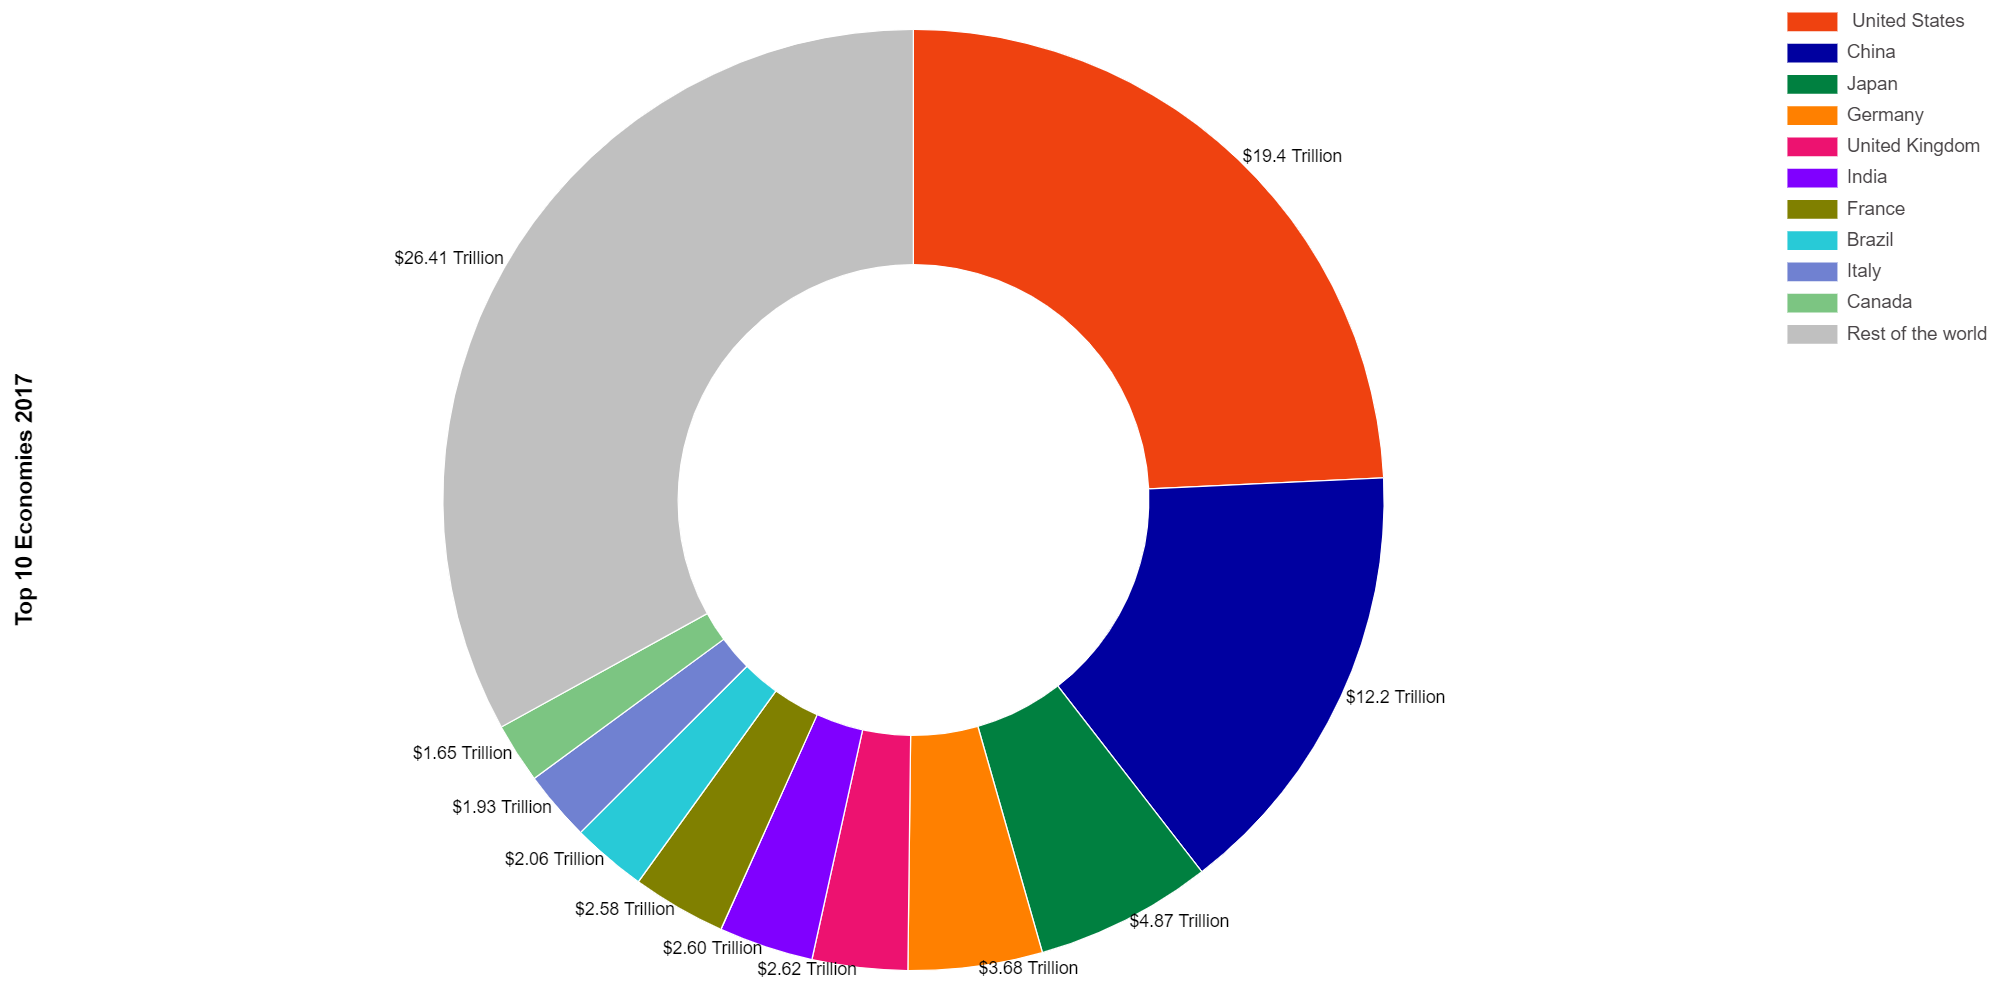
This is an example of Pie chart generated from this page:
- Chart Type: Doughnut Chart
- Title:
- Title Text: Top 10 Economies 2017
- Title Font-Size: 18.
- Title Color: #000.
- Title Position: Left.
- Labels: United States;China;Japan;Germany;United Kingdom;India;France;Brazil;Italy;Canada;Rest of the world
- Data Sets: 1
- Set Name: Economy
- Slices Values: 19.4;12.2;4.87;3.68;2.62;2.60;2.58;2.06;1.93;1.65;26.41
- Colors: #ef4210; #0000a0; #008040; #ff8000; #ed1270; #8000ff; #808000; #28cad7; #7081d1; #7cc582; #c0c0c0
- Legend Position: Right
- On Chart (OC): Values
- OC: Value Prefix/Suffix: Prefix/Suffix
- OC: Value Prefix/Suffix Value: $; Trillion
- OC: Position: Outside
- OC: Font Size: 14
- OC: Font Color: #ffffff
